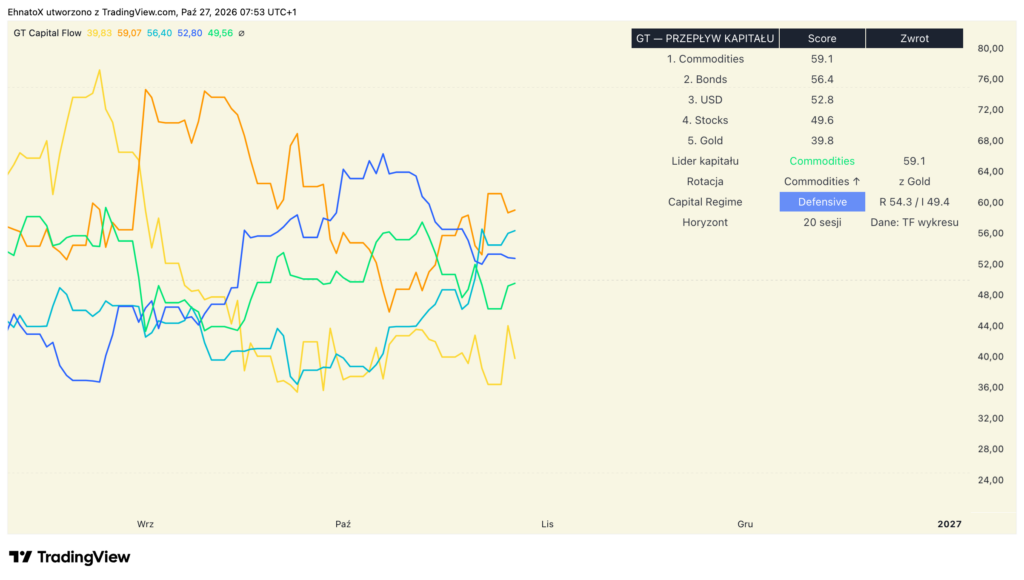
GT — GDZIE WĘDRUJE KAPITAŁ? (GT Capital Flow)
Praktyczny wskaźnik makroekonomiczny dla TradingView, który pomaga określić, w które klasy aktywów napływa obecnie kapitał, a z których odpływa. Wskaźnik analizuje relatywną siłę, pęd oraz ryzyko kluczowych rynków w wybranym horyzoncie czasowym, eliminując szum rynkowy.
🛑 Problem, który rozwiązuje wskaźnik
Pojedynczy wykres (np. S&P 500 czy złota) nie pokazuje pełnego obrazu rynku. Często wzrost danego aktywa wynika jedynie ze słabości dolara, a nie z faktycznego napływu kapitału.
GT Capital Flow rozwiązuje ten problem, analizując jednocześnie 5 do 6 głównych klas aktywów i porównując je bezpośrednio ze sobą w czasie rzeczywistym.
🛠️ Jak działa wskaźnik? (Funkcjonalność)
Wskaźnik w tle pobiera dane dla głównych filarów globalnego rynku:
- 📈 Stocks (Akcje): SPY (S&P 500)
- 🥇 Gold (Złoto): XAUUSD
- 🛢️ Commodities (Surowce): DBC
- 🧾 Bonds (Obligacje): IEF (7-10 Year Treasury)
- 💵 USD (Dolar): DXY
- ₿ BTC (Bitcoin): BTCUSD (opcjonalnie)
Algorytm punktacji (Score 0-100)
Dla każdego aktywa obliczany jest wynik zbiorczy (Score) w skali 0 – 100, będący średnią z 3 komponentów:
- Pęd (Momentum): Absolutna stopa zwrotu w danym horyzoncie.
- Siła Względna (RS): Stopa zwrotu aktywa w porównaniu do średniej stopy zwrotu pozostałych rynków.
- Zwrot skorygowany o ryzyko (Sharpe/Vol): Relacja stopy zwrotu do zmienności (odchylenia standardowego) w danym okresie.
Punkt odniesienia: Poziom 50 to wartość neutralna. Wyniki powyżej 75 oznaczają silny napływ kapitału, a poniżej 25 odpływ/słabość.
📊 Panel informacyjny (Dashboard) i Reżimy Rynkowe
W prawym górnym rogu wykresu znajduje się dynamiczny panel, który dostarcza natychmiastowych wniosków:
- Ranking siły: Uszeregowana lista aktywów od najsilniejszego (Lider) do najsłabszego (Lag).
- Lider Kapitału & Rotacja: Wskazuje, gdzie znajduje się główny strumień pieniędzy oraz kierunek jego zmiany.
- Capital Regime (Reżim Kapitałowy): Wskaźnik automatycznie klasyfikuje obecną fazę rynku na podstawie wyników składowych:
- 🟢 Risk On: Kapitał płynie do akcji (i ew. BTC/surowców). Apetyt na ryzyko jest wysoki.
- 🟠 Inflation: Dominują złoto i surowce. Rynek wycenia presję inflacyjną.
- 🔵 Defensive: Kapitał ucieka do bezpiecznych przystani (obligacje i USD).
- 🔴 Stress: Jednoczesny wzrost dolara i obligacji przy słabości akcji – sygnał kryzysowy/awersji do ryzyka.
📖 Jak korzystać ze wskaźnika w praktyce?
1. Wybór horyzontu (Horizon)
W ustawieniach wskaźnika możesz dostosować horyzont czasowy w zależności od swojego stylu handlu:
- 5 sesji: Krótkoterminowe rotacje (scalping / daytrading / taktyczny swing).
- 20 sesji (~1 miesiąc): Standardowy swing trading (rekomendowane ustawienie domyślne).
- 60–120 sesji (3–6 miesięcy): Inwestowanie średnio- i długoterminowe.
Dane odczytujemy na interwale D (dziennym). - ⚙️ Instrukcja instalacji na TradingView
- Otwórz platformę TradingView.
- Na dole ekranu otwórz zakładkę Edytor Pine (Pine Editor).
- Wklej kod źródłowy wskaźnika.
- Kliknij Zapisz (Save), a następnie Dodaj do wykresu (Add to chart).
- Wykres wskaźnika pojawi się w dolnym panelu pod głównym wykresem świecowym. (zalecany wykres SPX)
//@version=6
indicator("GT — GDZIE WĘDRUJE KAPITAŁ? www.longplan.pl", shorttitle="GT Capital Flow", overlay=false)

// Scores compare normalized total returns over the selected lookback.
// All security calls use the chart timeframe and explicitly disable lookahead.

horizonChoice = input.string("20", "Horyzont (sesje)", options=["5", "20", "60", "120"])
lookback = int(str.tonumber(horizonChoice))
useBTC = input.bool(false, "Uwzględnij BTC")
symGold = input.symbol("OANDA:XAUUSD", "Gold — XAUUSD")
symCom = input.symbol("AMEX:DBC", "Commodities — DBC")
symBonds = input.symbol("NASDAQ:IEF", "Bonds — IEF")
symUSD = input.symbol("TVC:DXY", "USD — DXY")
symStocks = input.symbol("AMEX:SPY", "Stocks — SPY")
symBTC = input.symbol("COINBASE:BTCUSD", "BTC — BTCUSD")

f_market(_symbol, _n) =>
    request.security(_symbol, timeframe.period,
      [close, close[_n], ta.stdev(math.log(close / close[1]), _n) * math.sqrt(_n)],
      gaps=barmerge.gaps_off, lookahead=barmerge.lookahead_off, ignore_invalid_symbol=true)

f_ret(_now, _then) => not na(_now) and not na(_then) and _then != 0 ? _now / _then - 1.0 : na
f_clip(_x) => math.max(-50.0, math.min(50.0, _x))
f_mom(_r) => not na(_r) ? 50.0 + f_clip(_r * 200.0) : na
f_risk(_r, _vol) => not na(_r) and not na(_vol) and _vol > 0 ? 50.0 + f_clip((_r / _vol) * 10.0) : na
f_mean4(_a, _b, _c, _d) =>
    float _sum = 0.0
    int _n = 0
    if not na(_a)
        _sum += _a
        _n += 1
    if not na(_b)
        _sum += _b
        _n += 1
    if not na(_c)
        _sum += _c
        _n += 1
    if not na(_d)
        _sum += _d
        _n += 1
    _n > 0 ? _sum / _n : na
f_rs(_r, _peerMean) => not na(_r) and not na(_peerMean) ? 50.0 + f_clip((_r - _peerMean) * 200.0) : na
f_score(_m, _rs, _ra) => not na(_m) and not na(_rs) and not na(_ra) ? (_m + _rs + _ra) / 3.0 : na
f_fmt(_x) => na(_x) ? "n/d" : str.tostring(_x, "#.0")
f_rank(_x) => na(_x) ? "—" : str.tostring(_x, "#.0")

[gNow,gThen,gVol] = f_market(symGold, lookback)
[cNow,cThen,cVol] = f_market(symCom, lookback)
[bNow,bThen,bVol] = f_market(symBonds, lookback)
[uNow,uThen,uVol] = f_market(symUSD, lookback)
[sNow,sThen,sVol] = f_market(symStocks, lookback)
[tNow,tThen,tVol] = f_market(symBTC, lookback)

gRet = f_ret(gNow,gThen)
cRet = f_ret(cNow,cThen)
bRet = f_ret(bNow,bThen)
uRet = f_ret(uNow,uThen)
sRet = f_ret(sNow,sThen)
tRet = useBTC ? f_ret(tNow,tThen) : na

gPeers = f_mean4(cRet,bRet,uRet,sRet) // BTC is added below when enabled via peer adjustment
cPeers = f_mean4(gRet,bRet,uRet,sRet)
bPeers = f_mean4(gRet,cRet,uRet,sRet)
uPeers = f_mean4(gRet,cRet,bRet,sRet)
sPeers = f_mean4(gRet,cRet,bRet,uRet)
// When BTC is enabled, include it in each asset's peer average by averaging the existing peers and BTC.
f_peerBTC(_baseMean, _baseN, _btc) => not useBTC or na(_btc) ? _baseMean : (_baseMean * _baseN + _btc) / (_baseN + 1)
// Base peer means have four peers; for enabled BTC the averages below are recalculated directly.
gPeer = useBTC ? f_mean4(cRet,bRet,uRet,sRet) : gPeers
cPeer = useBTC ? f_mean4(gRet,bRet,uRet,sRet) : cPeers
bPeer = useBTC ? f_mean4(gRet,cRet,uRet,sRet) : bPeers
uPeer = useBTC ? f_mean4(gRet,cRet,bRet,sRet) : uPeers
sPeer = useBTC ? f_mean4(gRet,cRet,bRet,uRet) : sPeers
// BTC peer means use all five core markets.
tPeer = f_mean4(gRet,cRet,bRet,uRet)
tPeer := not na(tPeer) and not na(sRet) ? (tPeer * 4.0 + sRet) / 5.0 : tPeer
// Apply BTC inclusion to each peer mean only when the BTC return is available.
gPeer := useBTC and not na(tRet) ? (gPeer * 4.0 + tRet) / 5.0 : gPeer
cPeer := useBTC and not na(tRet) ? (cPeer * 4.0 + tRet) / 5.0 : cPeer
bPeer := useBTC and not na(tRet) ? (bPeer * 4.0 + tRet) / 5.0 : bPeer
uPeer := useBTC and not na(tRet) ? (uPeer * 4.0 + tRet) / 5.0 : uPeer
sPeer := useBTC and not na(tRet) ? (sPeer * 4.0 + tRet) / 5.0 : sPeer

gScore = f_score(f_mom(gRet),f_rs(gRet,gPeer),f_risk(gRet,gVol))
cScore = f_score(f_mom(cRet),f_rs(cRet,cPeer),f_risk(cRet,cVol))
bScore = f_score(f_mom(bRet),f_rs(bRet,bPeer),f_risk(bRet,bVol))
uScore = f_score(f_mom(uRet),f_rs(uRet,uPeer),f_risk(uRet,uVol))
sScore = f_score(f_mom(sRet),f_rs(sRet,sPeer),f_risk(sRet,sVol))
tScore = useBTC ? f_score(f_mom(tRet),f_rs(tRet,tPeer),f_risk(tRet,tVol)) : na

// Composite regime scores: broad equity/BTC risk, inflation hedges, and defensive assets.
riskOn = useBTC and not na(tScore) ? (sScore + cScore + tScore) / 3.0 : (sScore + cScore) / 2.0
inflation = (gScore + cScore) / 2.0
defensive = (bScore + uScore) / 2.0
stress = not na(uScore) and not na(bScore) and not na(sScore) ? (uScore + bScore + (100.0 - sScore)) / 3.0 : na

// Plots keep the component scores inspectable in the Data Window.
plot(gScore, "Gold", color=color.new(color.yellow, 0), linewidth=2)
plot(cScore, "Commodities", color=color.new(color.orange, 0), linewidth=2)
plot(bScore, "Bonds", color=color.new(color.aqua, 0), linewidth=2)
plot(uScore, "USD", color=color.new(color.blue, 0), linewidth=2)
plot(sScore, "Stocks", color=color.new(color.lime, 0), linewidth=2)
plot(useBTC ? tScore : na, "BTC", color=color.new(color.fuchsia, 0), linewidth=2)
hline(50, "Neutral", color=color.new(color.gray, 65))
hline(75, "Strong", color=color.new(color.gray, 85))
hline(25, "Weak", color=color.new(color.gray, 85))

var table panel = table.new(position.top_right, 3, 11, border_width=1)
if barstate.islast
    table.clear(panel, 0, 0, 2, 10)
    array<float> rankScores = array.new_float()
    array<string> rankNames = array.new_string()
    if not na(gScore)
        array.push(rankScores, gScore)
        array.push(rankNames, "Gold")
    if not na(cScore)
        array.push(rankScores, cScore)
        array.push(rankNames, "Commodities")
    if not na(bScore)
        array.push(rankScores, bScore)
        array.push(rankNames, "Bonds")
    if not na(uScore)
        array.push(rankScores, uScore)
        array.push(rankNames, "USD")
    if not na(sScore)
        array.push(rankScores, sScore)
        array.push(rankNames, "Stocks")
    if useBTC and not na(tScore)
        array.push(rankScores, tScore)
        array.push(rankNames, "BTC")
    // Small selection sort, highest score first. The guard avoids an
    // inclusive loop starting at size when the final range is empty.
    int rankCount = array.size(rankScores)
    if rankCount > 1
        for i = 0 to rankCount - 2
            int best = i
            for j = i + 1 to rankCount - 1
                if array.get(rankScores, j) > array.get(rankScores, best)
                    best := j
            if best != i
                float scoreTmp = array.get(rankScores, i)
                string nameTmp = array.get(rankNames, i)
                array.set(rankScores, i, array.get(rankScores, best))
                array.set(rankNames, i, array.get(rankNames, best))
                array.set(rankScores, best, scoreTmp)
                array.set(rankNames, best, nameTmp)
    table.cell(panel,0,0,"GT — PRZEPŁYW KAPITAŁU", bgcolor=color.rgb(28,35,48), text_color=color.white)
    table.cell(panel,1,0,"Score", bgcolor=color.rgb(28,35,48), text_color=color.white)
    table.cell(panel,2,0,"Zwrot", bgcolor=color.rgb(28,35,48), text_color=color.white)
    for i = 0 to math.min(array.size(rankScores), 6) - 1
        int row = i + 1
        table.cell(panel, 0, row, str.tostring(i + 1) + ". " + array.get(rankNames, i))
        table.cell(panel, 1, row, f_fmt(array.get(rankScores, i)))
        table.cell(panel, 2, row, "")
    string leaderName = array.size(rankNames) > 0 ? array.get(rankNames, 0) : "n/d"
    float leader = array.size(rankScores) > 0 ? array.get(rankScores, 0) : na
    string lagName = array.size(rankNames) > 0 ? array.get(rankNames, array.size(rankNames) - 1) : "n/d"
    float leaderPrev = leaderName == "Gold" ? gScore[1] : leaderName == "Commodities" ? cScore[1] : leaderName == "Bonds" ? bScore[1] : leaderName == "USD" ? uScore[1] : leaderName == "Stocks" ? sScore[1] : tScore[1]
    string leaderArrow = na(leaderPrev) or na(leader) ? "·" : leader > leaderPrev ? "↑" : leader < leaderPrev ? "↓" : "→"
    table.cell(panel,0,7,"Lider kapitału")
    table.cell(panel,1,7,leaderName, text_color=color.lime)
    table.cell(panel,2,7,f_fmt(leader))
    table.cell(panel,0,8,"Rotacja")
    table.cell(panel,1,8,leaderName+" "+leaderArrow)
    table.cell(panel,2,8,"z "+lagName)
    float maxRegime = math.max(math.max(nz(riskOn, -1),nz(inflation, -1)),math.max(nz(defensive, -1),nz(stress, -1)))
    string regime = maxRegime < 0 ? "n/d" : maxRegime == nz(riskOn, -1) ? "Risk On" : maxRegime == nz(inflation, -1) ? "Inflation" : maxRegime == nz(defensive, -1) ? "Defensive" : "Stress"
    table.cell(panel,0,9,"Capital Regime")
    table.cell(panel,1,9,regime, text_color=color.white, bgcolor=regime=="Risk On"?color.new(color.green,35):regime=="Inflation"?color.new(color.orange,30):regime=="Defensive"?color.new(color.blue,30):color.new(color.red,30))
    table.cell(panel,2,9,"R "+f_fmt(riskOn)+" / I "+f_fmt(inflation))
    table.cell(panel,0,10,"Horyzont")
    table.cell(panel,1,10,horizonChoice+" sesji")
    table.cell(panel,2,10,"Dane: TF wykresu")